The Showdown: Tableau v/s Google Data Studio for Marketers


To keep things contextual, I will stay focused on marketers in this post. However, many of the points discussed here are applicable to broader users of the products discussed.
Until Google introduced the Data Studio beta in 2016, most marketers relied on one of two options for reporting.
The first was good old spreadsheets, while spreadsheets worked at a limited scale they had glaring disadvantages for an enterprise — the inability to see data in real-time, limited exploration options, and above all the number of man-hours spent in extracting the data and preparing these spreadsheets.
The other route is to use a BI tool like Tableau. Tableau brings a lot of power to the table in terms of both visualization and the ability to slice and dice data and has seen widespread adoption for Marketing teams handling large digital budgets for dashboarding and reporting.
But, the launch of Google Data Studio (GDS) made even heavy Tableau users sit up and take notice. So what makes GDS interesting? Is it good enough to replace Tableau? Let’s find out.
Native Integrations
GDS natively integrates with Google’s suite of products like AdWords, DBM, etc. so effectively these platforms act as your data warehouses. No such luck with Tableau, you have to build and maintain data pipelines and store them in a data warehouse before you can connect Tableau on top to build visualizations.
But the minute you need to see non-Google data, the value of GDS falls dramatically — like Tableau, you’d need to use a warehouse or manually import data into Google Sheets. You can potentially use connectors to get non GA data into Sheets and then use GDS but then you can always do that on Tableau as well.
Marketing Context
GDS brings marketing context — after connecting your Adwords/Analytics accounts you can just search for the metrics and dimensions and voila, they are all there. This makes it really easy and fast to build dashboards for your Marketing teams. It also understands that metrics like bounce rate and Quality Score can’t just be summed up, you can also see the actual images instead of creative names or URL’s if you use the “Image” tag. You lose these nuances in Tableau. Unfortunately, GDS loses the context for non-Google data: comparing the performance of prospecting and retargeting campaigns on Facebook? Not so easy.

Data Joining
Tableau allows a full-funnel view of digital spend — ad data joined to analytics data. But, it could take weeks or months to set it up, and requires regular attention to ensure that joining is accurate. GDS, by the very nature of the way it accesses data through real-time API calls, does not support data joining unless you do it externally on a database/sheets.
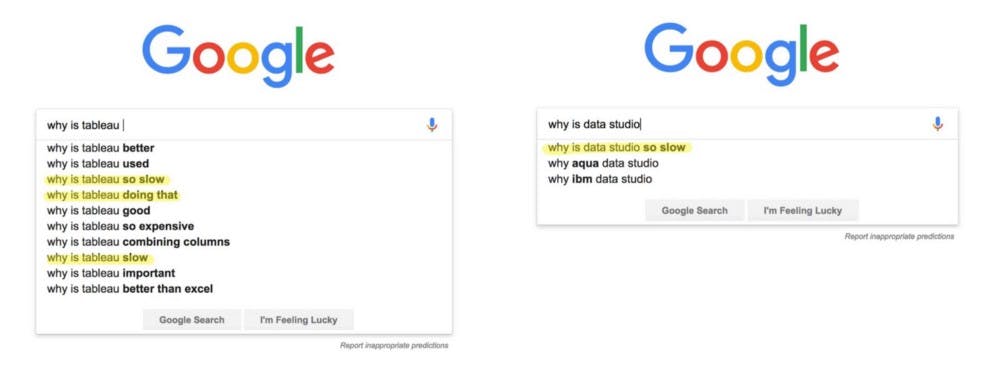
Why is everything so sloooooowwwww?
GDS can be really slow, one of the key complaints on the forums is how even simple queries take upwards of 30 seconds to load. This is the nature of the beast and the negative of making real-time queries to third party systems is that you really have to wait a long time for data to load.
Ease of use
For Google data, GDS carries significant advantages here — you can easily add custom dimensions, calculated metrics, etc. on the fly. Tableau Online is woefully inadequate, as you are forced to rely on data teams running the desktop version every time a new dimension or metric needs to be added, or changes made in reports.
Want to speak about automating all of your marketing reporting and insights, without needing data warehouses? Clarisights empowers you with advertising data joined to analytics/conversions at the highest possible granularity for each platform, in real-time.

Cost
Google removed the initial limits last year and made it completely free to use with unlimited reports. Tableau desktop costs $70/month/user for the pro edition, and Tableau Online costs $42/month/user. This adds up quickly for large teams, and the additional cost of building and maintaining your own data warehouse is also significant.
Dashboards vs Data exploration
If you want to get some dashboards up and running quickly with visualizations to share with the team and just keep track of KPIs, GDS is quicker to set up and easier to maintain. Tableau is overkill for this and as a very heavy BI application, it’s like using a hammer to swat a fly. But if you want to do more complex work like heavy data exploration, projections, attribution, etc. GDS just won’t work for you, in such cases, you are better off looking at dedicated BI solutions like Tableau or Looker.
Other minor kinks
- Tableau has a significant learning curve, and would probably need formal training. GDS is easy to pick up.
- Tableau supports data blending, while GDS does not at the moment.
- Tableau allows you to see multiple data sources in a single chart (courtesy data joining), while GDS does not.
- Tableau offers almost 2x the calculation functions that GDS does.
- Tableau is a far more mature product, hence its community and forums are very active. GDS’ forums are active too, just not as much as Tableau’s.
- Think of the composition of your team, if you have data nerds handy with SQL queries and data modeling, they will find GDS very limiting.
Broadly, here are a few points to think about while making a decision:
Tool v/s solution:
Do you want a tool to help your team quickly build dashboards (GDS), or are you looking for an end-to-end marketing data solution (Tableau)?
Channels:
What ad channels do you use? If it is largely Google ecosystem channels like AdWords, YouTube and DoubleClick then GDS will fit the bill. If you have many channels from outside Google’s advertising ecosystem, then Tableau makes sense.
Resources:
How much of an investment (money and time!) are you willing to make? Are you willing to sacrifice broader functionality to save costs?
We at Clarisights are attempting to solve the marketing data problem by building a reporting and exploration platform for performance marketers and agencies. To know more, visit our website.